-
Food & Agriculture
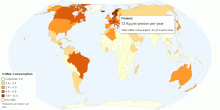
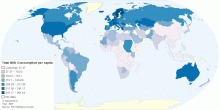
Current Worldwide Annual Coffee Consumption per capita
This map shows Coffee consumption in kilograms, consumed annually by each person in a given country or region. Current World Total Coffee Consumption: 1.3 Kilogr ...4.52 rating | 822,905 views | 26 Comments13 years ago -
Food & Agriculture
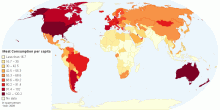
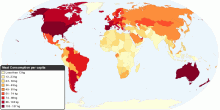
Current Worldwide Annual Meat Consumption per capita
This map shows current worldwide annual Meat Consumption per capita. World average meat consumption: 41.90 kg per person per year4.54 rating | 715,248 views | 46 Comments11 years ago -
Food & Agriculture
Daily Calorie Intake Per Capita
This map shows dietary energy consumption per person. The dietary energy consumption per person is the amount of food, in kcal per day, for each individual in th ...4.19 rating | 368,664 views | 18 Comments13 years ago -
Food & Agriculture
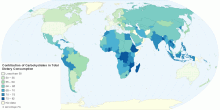
Contribution of Carbohydrates in Total Dietary Consumption
This map shows contribution of carbohydrates in total dietary energy consumption. World: 63% Developed countries: 53% Developing World: 67% Sub-Saharan Afr ...4.24 rating | 353,104 views | Discuss this13 years ago -
Food & Agriculture
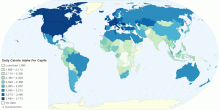
Current Worldwide Total Milk Consumption per capita
This map shows current worldwide total Milk consumption (excluding butter) per capita. World Average Milk Consumption: 108 kg per person per year4.52 rating | 255,453 views | Discuss this13 years ago -
Food & Agriculture
Current Worldwide Annual Meat Consumption per capita
This map shows current worldwide annual Meat Consumption per capita. World average meat consumption: 46.6 kg per person per year4.69 rating | 177,263 views | 25 Comments14 years ago -
Food & Agriculture
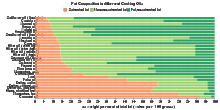
Fat Composition in different Cooking Oils
This chart shows fat composition in different Cooking Oils. Cooking oil is purified fat of plant/animal origin, which is usually liquid at room temperature (satu ...4.72 rating | 155,072 views | 4 Comments13 years ago -
Food & Agriculture
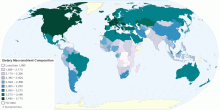
Dietary Macronutrient Composition per capita
This map shows dietary macronutrient composition per person. The dietary energy consumption per person is the amount of food, in kcal per day, for each individua ...4.35 rating | 144,932 views | Discuss this13 years ago -
Food & Agriculture
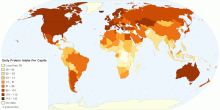
Daily Protein Intake Per Capita
This map shows dietary protein consumption per person. The dietary protein consumption per person is the amount of protein in food, in grams per day, for each in ...4.61 rating | 133,547 views | 1 Comment13 years ago -
Food & Agriculture
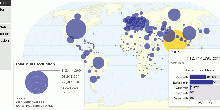
Global Milk Production and Consumption
This map shows current worldwide Milk production and consumption. World Total Milk Production: 703,996,079 tonnes per year World Total Milk Consumption (excludin ...4.39 rating | 121,782 views | 8 Comments13 years ago -
Food & Agriculture
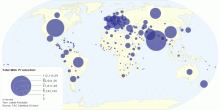
Current Worldwide Total Milk Production
This map shows current worldwide total Milk production. World Total Milk Production: 703,996,079 tonnes per year Note: Total Milk = Cow milk + Buffalo milk + G ...4.39 rating | 118,600 views | 4 Comments13 years ago -
Food & Agriculture
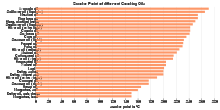
Smoke Point of different Cooking Oils
This chart shows smoke point of different Cooking Oils. The smoke point generally refers to the temperature at which a cooking fat or oil begins to break down t ...4.43 rating | 103,539 views | 3 Comments13 years ago -
Food & Agriculture
Global Nutrition Consumption and BMI
This map shows worldwide nutrition consumption and body mass index data. The dietary energy consumption per person is the amount of food, in kcal per day, for ea ...3.95 rating | 100,929 views | 7 Comments13 years ago -
Food & Agriculture
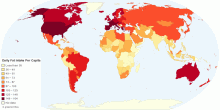
Daily Fat Intake Per Capita
This map shows dietary fat consumption per person. The dietary fat consumption per person is the amount of fat in food, in grams per day, for each individual in ...4.52 rating | 77,533 views | 4 Comments13 years ago -
Food & Agriculture
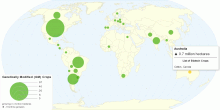
Global Distribution of Genetically Modified (GM) Crops
This map shows global distribution of Genetically Modified (GM) crops. Current World hectarage of biotech crops: 148.6 million hectares in 2010 World hectara ...4.36 rating | 74,230 views | 2 Comments13 years ago